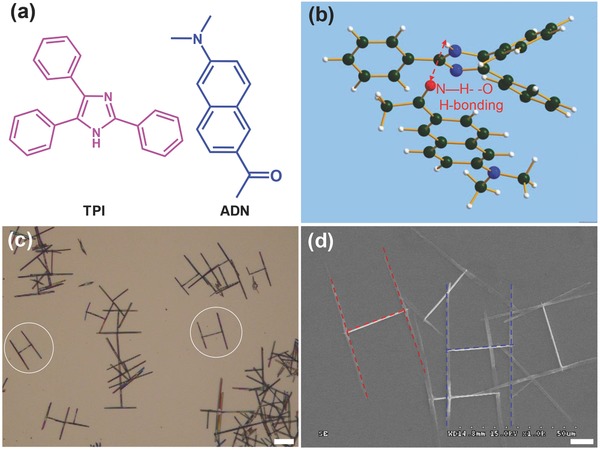
Figure 1.

a) Molecular structures of TPI and ADN. b) The simulated optimal steric configuration of TPI and ADN molecules, which shows the intermolecular hydrogen bonding interactions between them. c) Bright‐field optical microscopy image of the “H”‐like organic nanowire heterojunctions. Scale bar is 20 μm. d) SEM image of the “H”‐like heterostructures. The red‐ and blue dashed lines are added to identify the single “H”‐like structures. Scale bar is 10 μm.
