Figure 3.

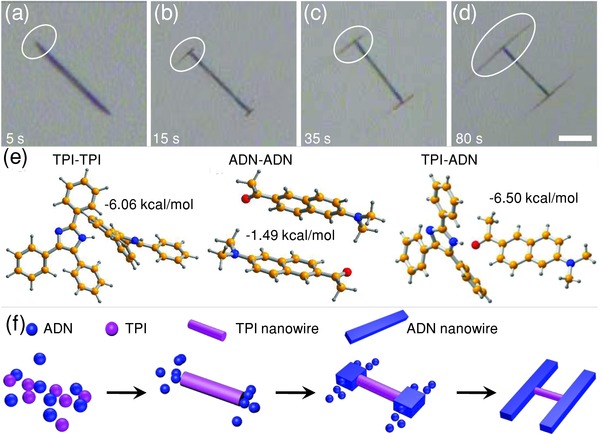
Temporal bright‐field optical microscopy images at different growth stages taken at a) 5 s, b) 15 s, c) 35 s, and d) 80 s after the dropping of water into the mixed solution. Scale bar is 10 μm. e) The configurations of TPI–TPI along [001] direction, ADN–ADN along [010] direction, and TPI–ADN at the junctions. f) Schematic illustration for the growth process of the “H”‐like nanowire heterojunctions.
