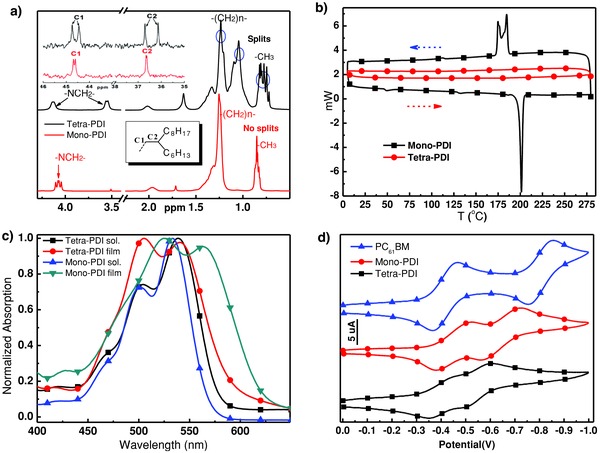
Figure 2.

a) 1H NMR signal of N‐alkyl chain of tetra‐PDI and mono‐PDI (The insertion on top left is 13C NMR for C1 and C2); b) DSC curves of tetra‐PDI and mono‐PDI; c) UV–vis absorption spectra of tetra‐PDI and mono‐PDI in solution and solid films; d) CV curves for tetra‐PDI, mono‐PDI, and PC61BM in CH2Cl2 solutions.
