Figure 5.

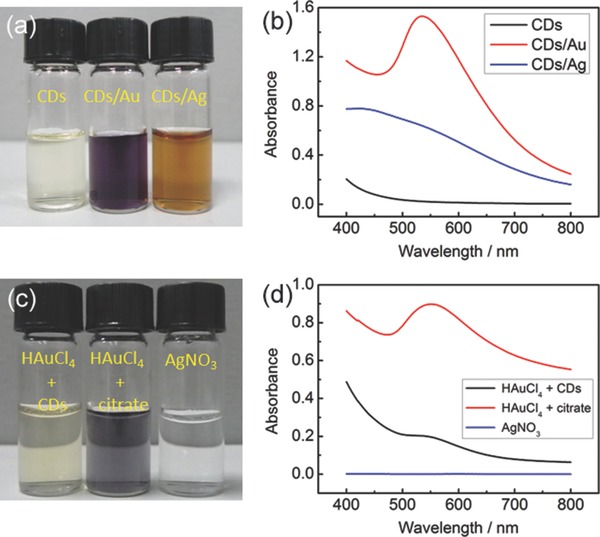
a) A photograph showing suspensions of r‐CDs, r‐CDs/Au, and r‐CDs/Ag and b) the corresponding absorption spectra. c,d) A photograph of solutions and the corresponding absorption spectra for the control sets.

a) A photograph showing suspensions of r‐CDs, r‐CDs/Au, and r‐CDs/Ag and b) the corresponding absorption spectra. c,d) A photograph of solutions and the corresponding absorption spectra for the control sets.