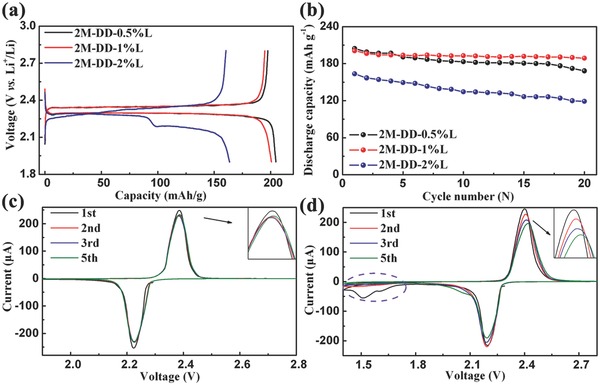
Figure 3.

a) First discharge–charge curves and b) cycling performance of the AQ with different concentrations of LiNO3 additive at 0.1 C. Cyclic voltammograms of the AQ with 2m‐DD‐1%L electrolyte at a scan rate of 0.1 mV s−1 in the different range c) 1.9–2.8 V and d) 1.4–2.8 V.
