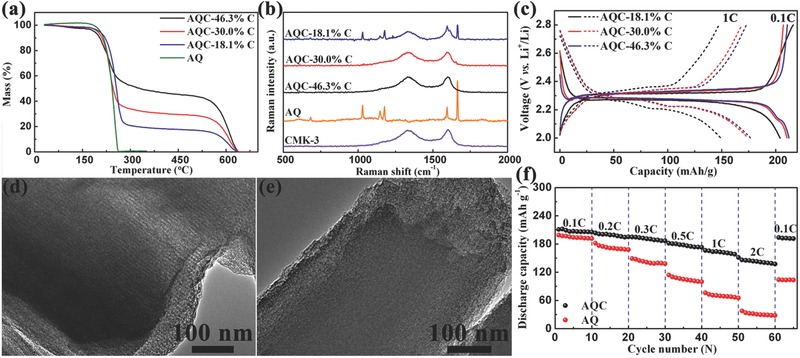
Figure 4.

a) Thermogravimetric analysis curves of AQ and AQ/CMK‐3 (AQC) with different carbon contents. b) Raman spectra of CMK‐3, AQ, and AQC with different carbon contents. c) First discharge–charge curves of the AQC with different carbon contents at 0.1 C (line) and 1 C (dash). TEM images of d) CMK‐3 and e) AQC with 30 wt% CMK‐3. f) Discharge capacity of AQC with 30 wt% CMK‐3 and bare AQ cycled at various rates from 0.1 to 2 C.
