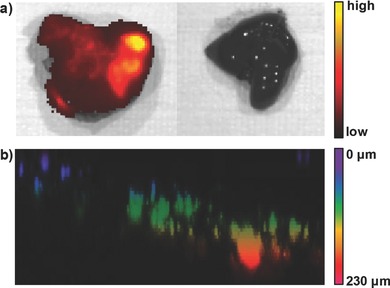
Figure 4.

a) Representative ex vivo fluorescence images of the liver collected from mouse transplanted with 4 × 10⁶ of PIDT‐DBT‐Tat NP‐labeled HepG2 cells (left) and mouse without transplantation (right) after 42‐day injection (λ ex = 640 nm, 720/20 nm filter). b) 3D color‐coded projection of z‐stacks of confocal images (λ ex = 590 nm, 600–800 nm bandpass filter).
