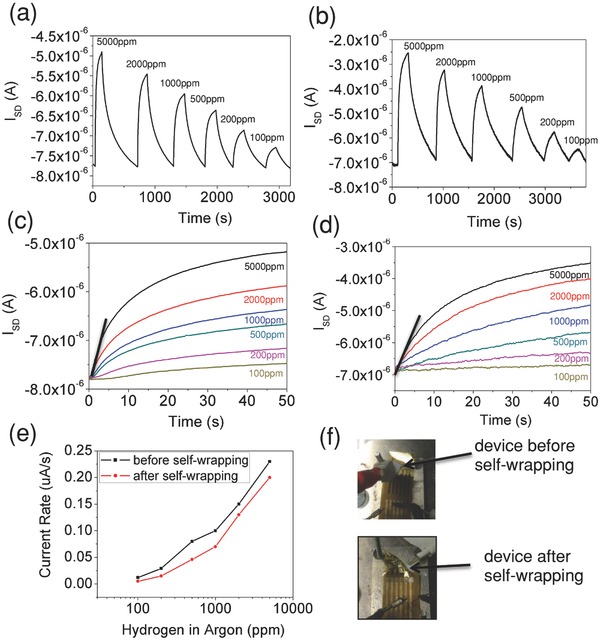
Figure 6.

Hydrogen sensor device characteristics. Pd‐decorated SWNT sensor exposed to different concentration of hydrogen relative to argon a) before and b) after self‐wrapping process. The initial current rising rate of Pd‐decorated SWNT sensor exposed to different concentration of hydrogen gas relative to argon c) before self‐wrapping and d) after self‐wrapping. e) Plot of the current rising rate versus hydrogen concentration in argon before and after self‐wrapping process. f) Image of the device before and after self‐wrapping.
