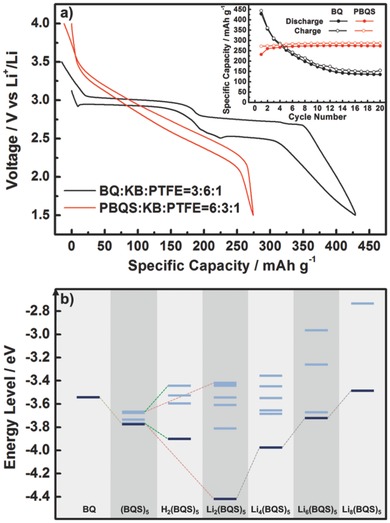
Figure 2.

a) Typical discharge/charge curves of BQ (1.5–3.5 V, 1st cycle) and PBQS (1.5–4.0 V, 10th cycle) under the same current rate of 50 mA g–1. Inserted graph shows corresponding cycling performance within 20 cycles. Note that much lower BQ loading (30%) was used to restrain its dissolution in the electrolyte. b) Energy level diagram obtained by DFT calculation for the monomer (BQ), simulated polymer containing five structure units [(BQS)5], simulated polymer with residual hydroquinone group [H2(BQS)5], and in different reduction states [Li2(BQS)5, Li4(BQS)5, Li6(BQS)5, Li8(BQS)5]. Dark blue lines are the LUMOs and light blue lines are characteristic nearby unoccupied orbitals.
