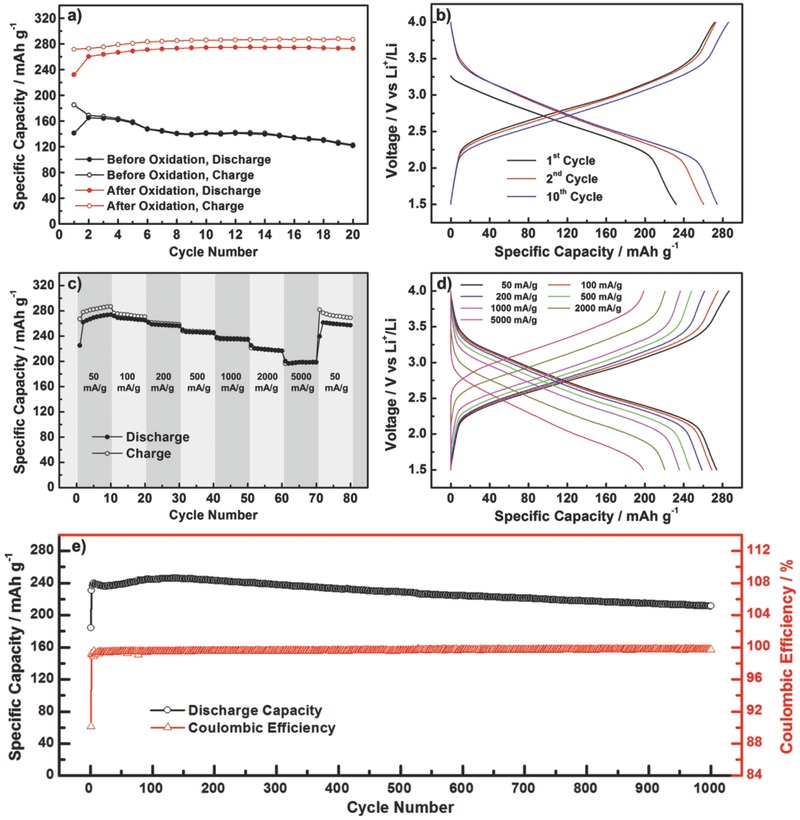
Figure 3.

a) Discharge/charge capacity profiles versus cycle number under 50 mA g–1 for PBQS samples before and after oxidation. b) Voltage profiles of the 1st, 2nd, and 10th cycle for PBQS after oxidation. c) Discharge/charge capacity profiles versus cycle number under sequentially changed current rate from 50 to 5000 mA g–1. d) Corresponding voltage profiles under different current rates. e) Long‐term cycling profiles within 1000 cycles under a current rate of 500 mA g–1.
