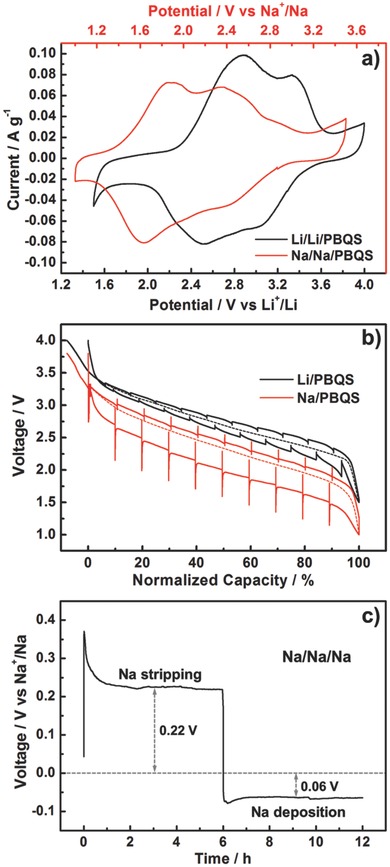
Figure 5.

a) Typical CV curves of Li/Li/PBQS and Na/Na/PBQS three‐electrode battery at a scan rate of 0.1 mV s–1, in voltage range of 1.5–4.0 V versus Li+/Li and 1.0–3.5 V versus Na+/Na, respectively. b) Quasi‐open‐circuit voltage (QOCV) profiles of Li/PBQS (1.5–4.0 V) and Na/PBQS (1.0–3.8 V) coin cells at a current rate of 50 mA g–1, with a relaxation time of 2 h after each discharge or charge step of 0.5 h. c) Voltage profiles of Na/Na/Na three‐electrode battery at a current density of 50 μA cm–1, to show the overpotential of Na electrode. For all the above tests, 1 m LiTFSI/DOL + DME electrolyte was used for Li battery, while 1 m NaTFSI/DOL + DME electrolyte was used for Na battery.
