Figure 1.

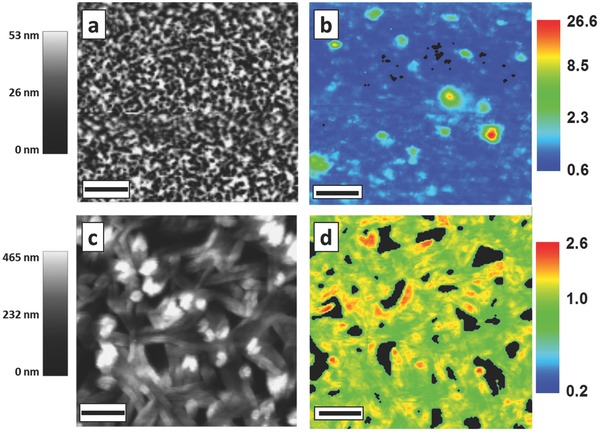
Topography (left), and map of the ratio between locally detected versus spatially averaged PL intensity (right) for spin‐coated a,b) methylammonium lead bromide CH3NH3PbBr3 and c,d) methylammonium lead iodide CH3NH3PbI3 perovskite thin‐films on glass. Films were excited using a continuous wave laser (λ exc = 405 nm) in a scanning near‐field optical microscope (SNOM) setup. The PL emission was collected in transmission mode with confocal geometry. PL maps were corrected for small differences in absorption by measuring the transmitted excitation laser intensity. We observe localized spatial variations in PL intensity up to a factor of 26 (CH3NH3PbBr3) and 2.6 (CH3NH3PbI3), which do not show a correlation to features in topography. Maps have been collected over 130 by 130 data points. Length of scale bar = 4 μm.
