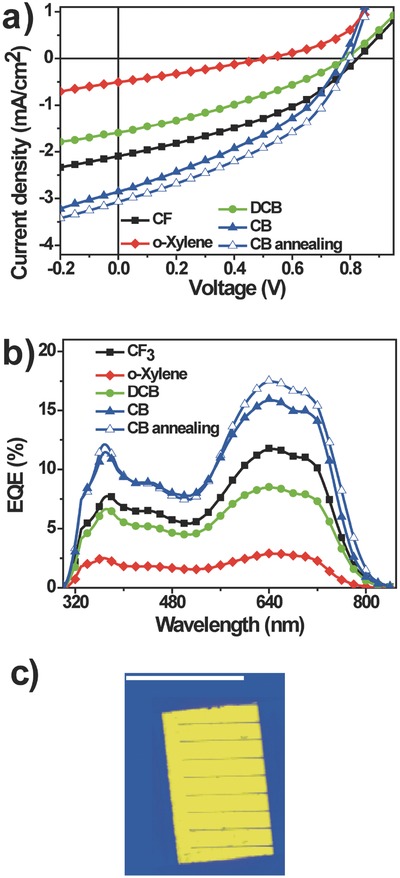
Figure 3.

a) J–V curves and b) EQE spectra of devices with the structure PET/Ag/PEDOT:PSS PH1000/ZnO/PBDTTT‐C‐T:DC‐IDT2T/PEDOT:PSS EL‐P5010/Ag with different processing solvent and thermal annealing under the illumination of an AM 1.5G solar simulator, 100 mW cm−2; c) Device area as shown in the LBIC62 image, the scale bar is 1 cm.
