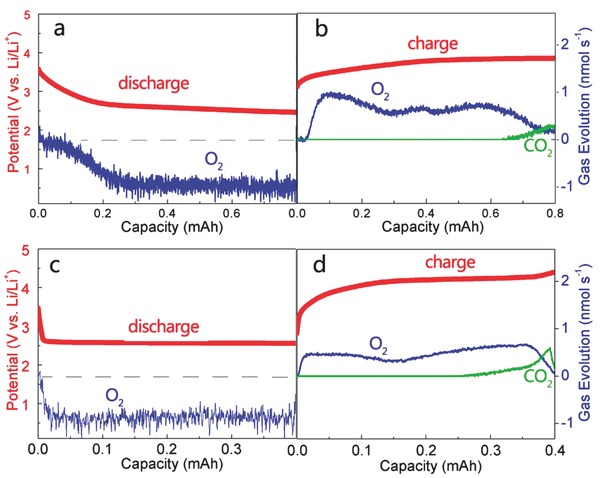
Figure 4.

Differential electrochemical mass spectrometry (DEMS) analysis of the evolved gases during the a) discharge and b) charge of a Li–O2 cell with RuOx/TiN NTA cathode. DEMS analysis of the evolved gases during the c) discharge and d) charge of a Li–O2 cell with Super P cathode. The right axis represents the detected gas evolution of O2 (blue line) and CO2 (green line), the left axis shows the potential of the discharging step and charging step (red line).
