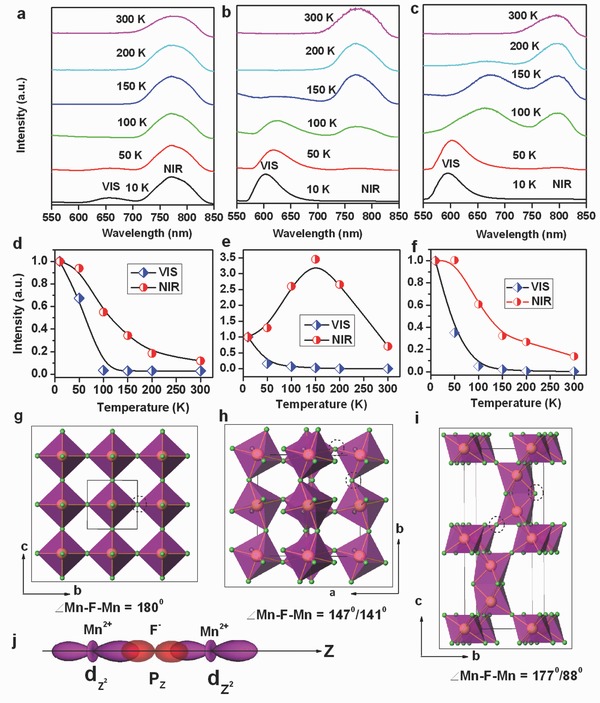
Figure 4.

PL spectra of a) KMnF3; b) NaMnF3 and c) CsMnF3 at various temperatures ranging from 10 to 300 K; d–f) show variations of temperature‐dependent emission intensities of VIS and NIR emissions for KMnF3, NaMnF3, and CsMnF3, respectively; g–i) crystal structures of KMnF3, NaMnF3, and CsMnF3, respectively (for clarity, the alkali cations are omitted in the structures and only the MnF6 octahedra are shown); and j) schematic representation of the most important sigma overlaps between the d orbitals of Mn2+ and the p orbital of ligand F− with a bridging angle of 180°.
