
Figure 3.
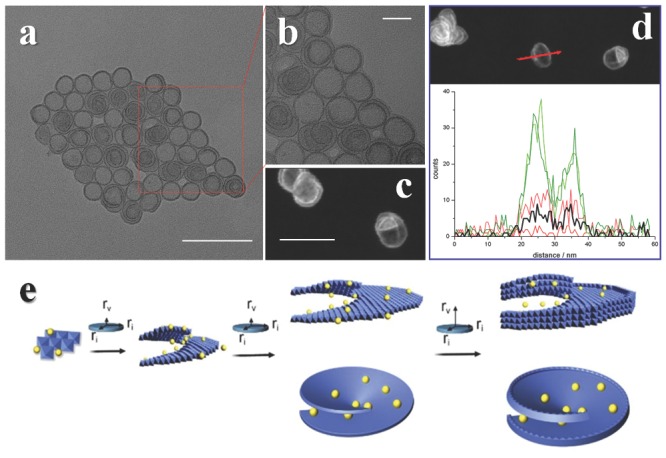
Spiral ultrathin nanosheets with overgrown edges (SUNOE). a,b) TEM and c,d) STEM images of NiFe SUNOE, the element line scan (d, down) indicates the ratios of metal to growth inhibitor vary with position (black line stands for growth inhibitor and other lines stands for metals). e) Growth mechanism of SUNOE, yellow balls represent growth inhibitor, after the concentration of inhibitors in solution decrease a lot, the growth rate of vertical to plane is released and cause an overgrowth at edges. Scale bars: a) 100 nm; b) 20 nm; and c) 50 nm. Reproduced with permission.55 Copyright 2015, Royal Society of Chemistry.