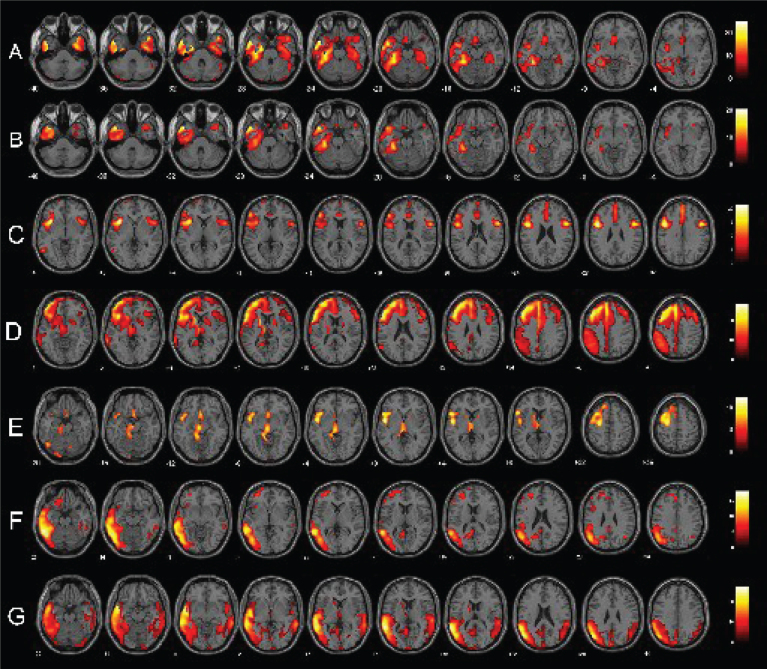
Fig.1.
Single-subject FDG-PET SPM t-maps of PPA patients. Panels A and B show respectively a bilateral and a left-predominant pattern of anterior temporal hypometabolism in two sv-PPA patients. Panels C, D, and E represent respectively patterns of pure nfv-PPA, nfv-PPA classified as CBD and as PSP at the follow-up. Finally, panels F and G show lv-PPA with a left-predominant and a bilateral pattern of hypometabolism. FDG-PET SPM brain hypometabolism patterns are shown in axial view, p < 0.001 uncorrected.

