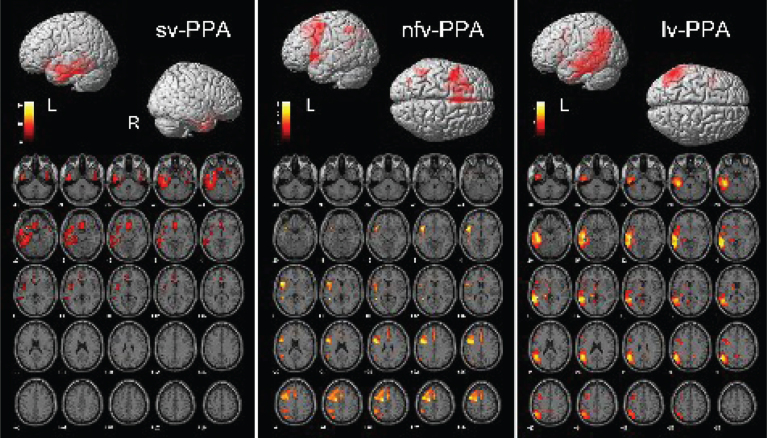
Fig.2.
Brain regions showing significant FDG-PET hypometabolism in the primary progressive aphasia (PPA) variants. On the bottom side of each figure, the FDG-PET hypometabolic pattern resulting from the one-sample SPM group analysis is shown in axial view (x = [–40:+56]; p < 0.001 uncorrected). On the upper side of each figure, left (L) and right (R) renders are shown. See text for details of the involved brain regions.

