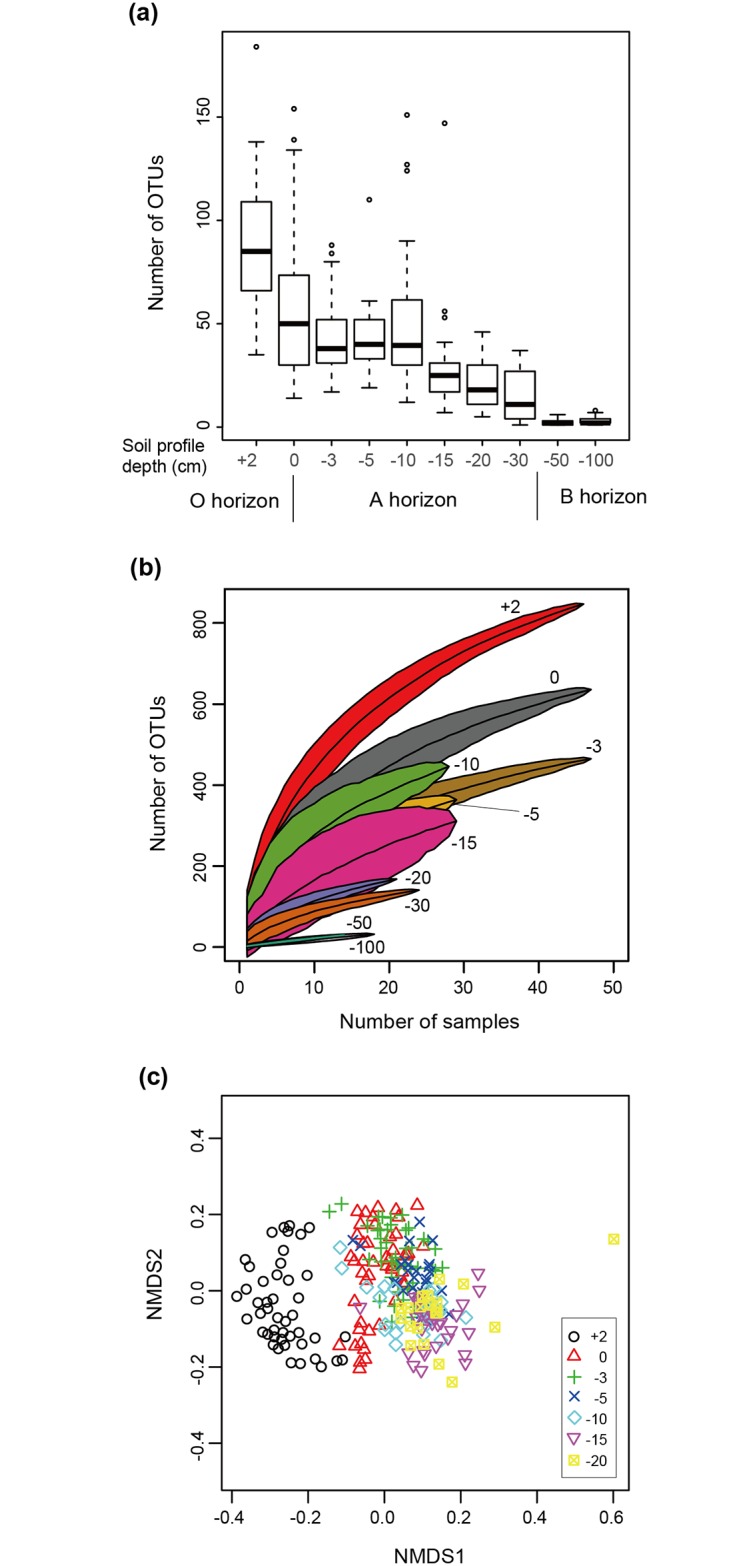
Fig 1. Variation in the diversity and community structure of soil fungi along sampling depth.

(a) Number of fungal OTUs per sampling position. A box indicates the first and third quartiles and a thick line shows the median of a focal sampling depth. (b) Relationship between the number of sampling positions and that of fungal OTUs at each sampling depth. The number of sampling positions from which 1000 or more sequencing reads were obtained decreased along sampling depth. (c) NMDS visualization of fungal community structure.
