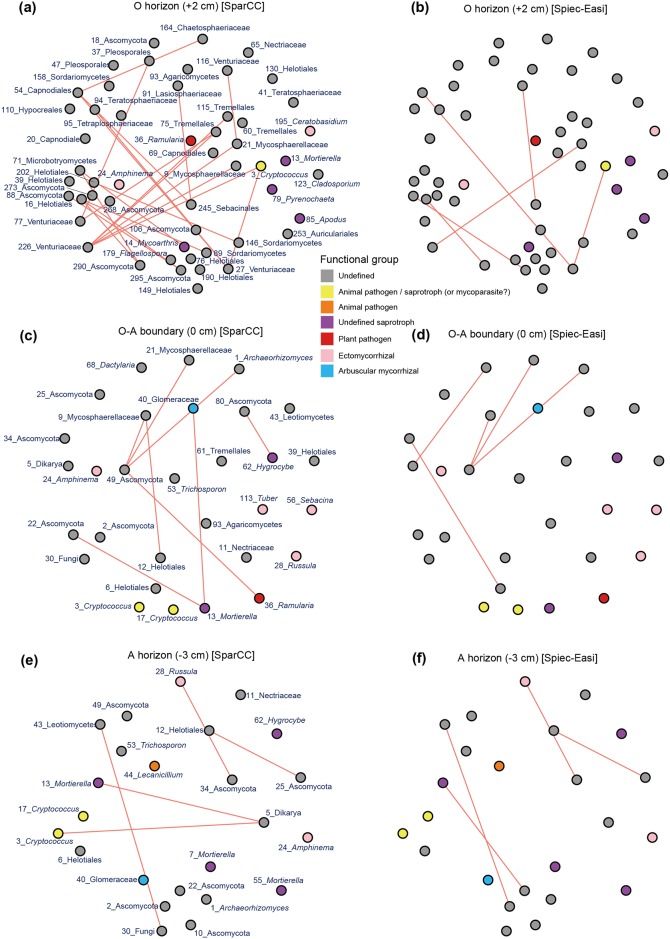
Fig 5. Negative co-occurrence networks.
Based on the SparCC (left) and Spiec-Easi (right) methods, pairs of fungi displaying segregated distributions across the soil samples were indicated. The ID and the lowest taxonomic information are shown for each fungal OTU. (a-b) O horizon (+2 cm). (c-d) O-A boundary (0 cm). (e-f) A horizon (-3 cm).

