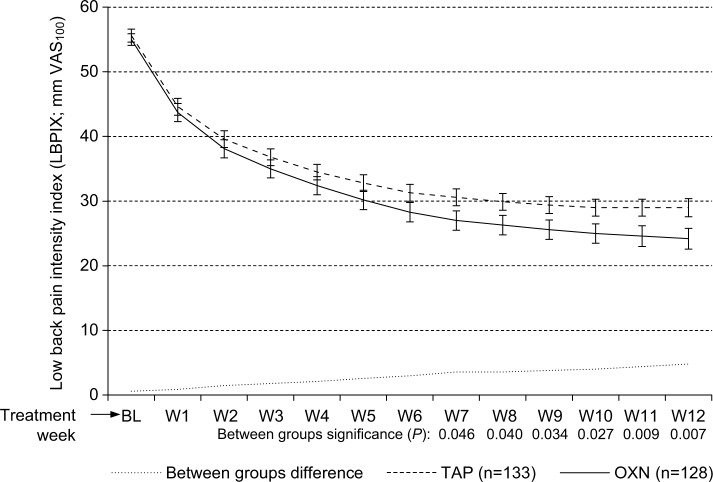
Figure 2.
Change of the LBPIX (mean ±95% CIs) during the course of the 12-week observation with TAP (n=133, dashed line) and OXN (n=128, solid line).
Notes: LBPIX improved significantly for both treatment groups vs baseline (P<0.001 for each), but was significantly superior for OXN vs TAP (P<0.05 from the end of Week 7 until the end of Week 12). Dotted line in the lower part of the graph marks the between group difference.
Abbreviations: VAS100, 100 mm visual analog scale (0: no pain, 100: worst pain conceivable); BL, baseline; W1–W12, treatment Weeks 1–12; LBPIX, low back pain intensity index; 95% CIs, 95% confidence intervals; OXN, oxycodone/naloxone; TAP, tapentadol.

