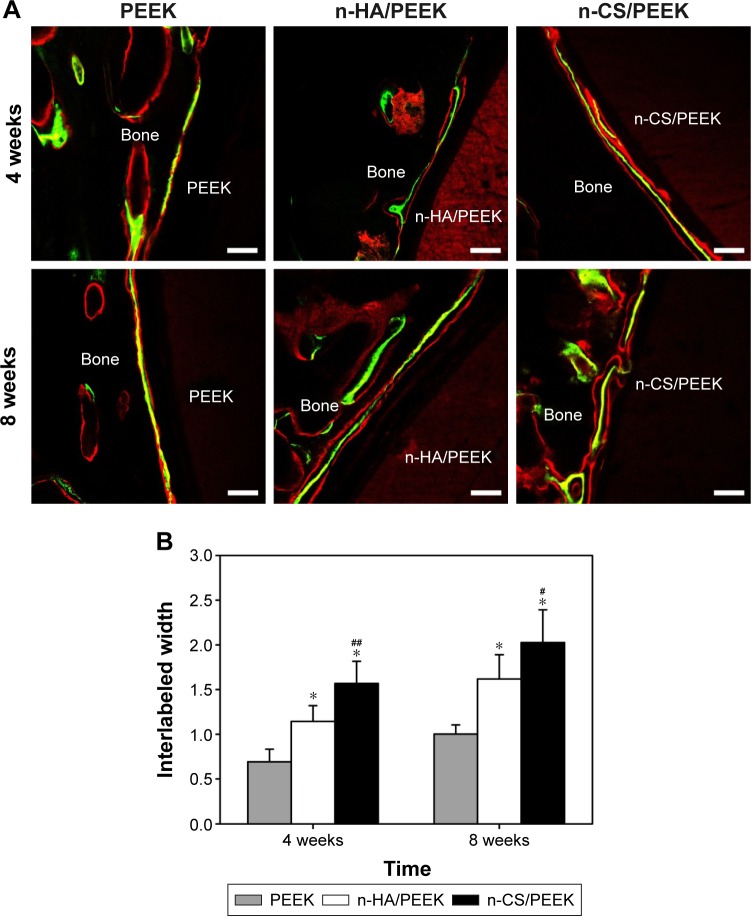
Figure 5.
Fluorescence microscopy of new bone formation labeled by alizarin red and calcein after 4 and 8 weeks.
Notes: (A) Representative CLSM images. The red fluorescence is due to alizarin red labeling, and the yellow-green fluorescence is due to by calcein labeling. The scale bar is 100 μm. (B) Quantitative analysis of new bone formation. *Represents a significant difference compared to PEEK (P<0.01), and #represents a significant difference compared with n-HA/PEEK (#P<0.05, ##P<0.01).
Abbreviations: PEEK, polyetheretherketone; n-HA, nanohydroxyapatite; n-CS, nano-calcium silicate; CLSM, confocal laser scanning microscopy.

