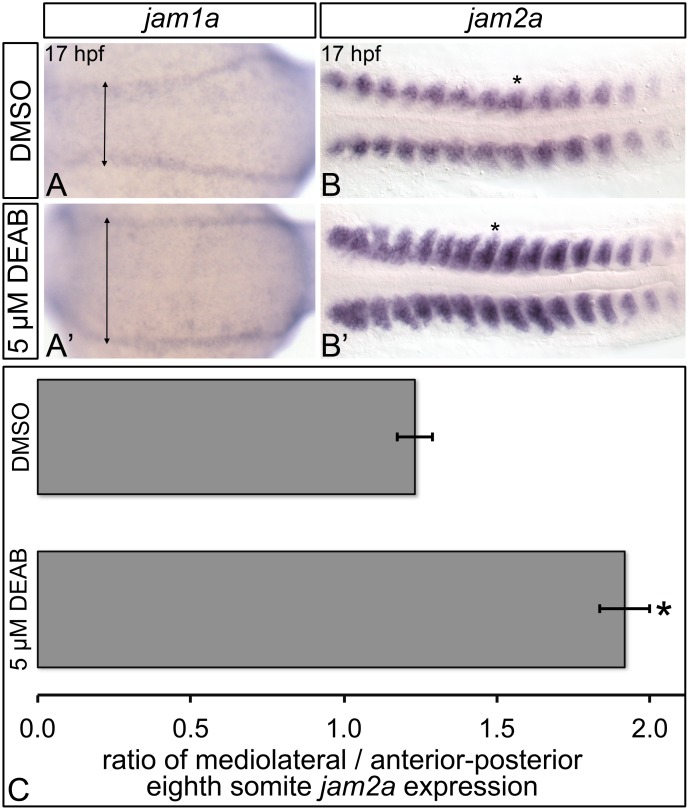
Fig 6. RA-deficient embryos exhibit abnormal jam1a and jam2a expression.
Representative flat-mount 17 hpf embryos following in situ hybridization analyses. Dorsal view of gene expression is shown with anterior to the left. Compared to DMSO-treated controls (A), embryos treated with 5 μM DEAB (A’) exhibit wild type levels of jam1a expression, and extreme lateral positioning of the anterior-most domains of jam1a expression (double-headed arrows). Compared to DMSO-treated controls (B), embryos treated with 5 μM DEAB (B’) display strongly increased somitic jam2a expression, and lateral expansion of the jam2a expression domain. (C) Graph demonstrating length of the domain of jam2a expression along the medio-lateral axis, divided by length of the domain of expression along the anterior-posterior axis of the eighth jam2a-expressing somite on the right side of the embryo (see asterisk in B, B’). Error bars represent standard error *Indicates statistically significant difference in ratio compared to DMSO-treated controls (P < 0.0001). See text for statistical tests.

