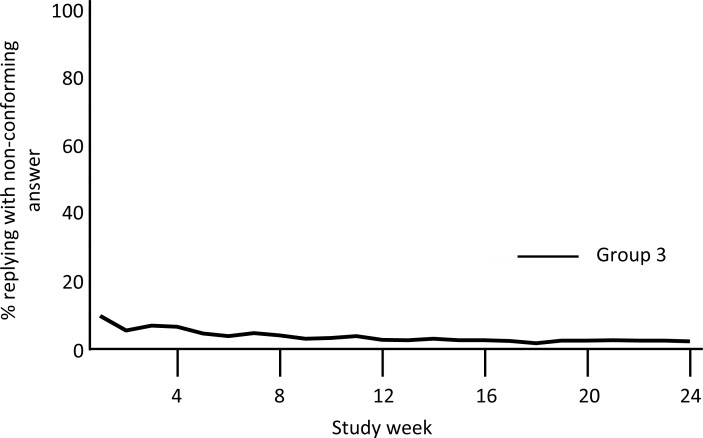
Fig 5. Weekly non-conforming answer rates (Group 3 only).
This summarizes the week-by-week average rates of non-conforming answers sent back by Group 3 participants. Responses were interpretable only if in the formats ‘a’, ‘b’, ‘c’, ‘d’, or ‘A’, ‘B’, ‘C’, or ‘D’. All other responses were ‘non-conforming’. Non-conforming answers were most common in the initial few weeks of the study, and then fell to < 10%.

