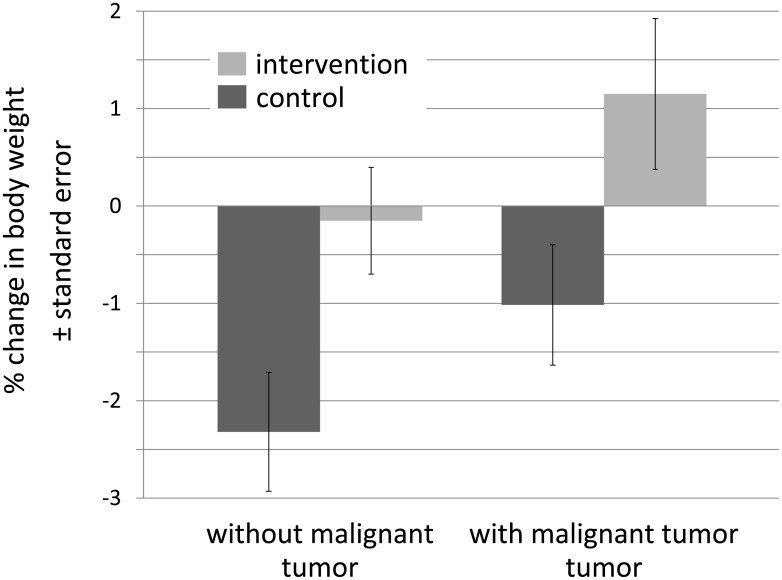
Fig 2. Mean weight changes by intervention and tumor status.
Shown are expected marginal means at means of the covariates (sex, age, length of hospital stay, electrolyte solution, weight at admission, malignant tumor, oral supplements and proportion of fasting time). However, the difference between tumor group (total n = 39; control = 19, intervention n = 20) and non-tumor group (total n = 40; control n = 21; intervention = 19) in body-weight change was not statistically significant (p = 0.058).

