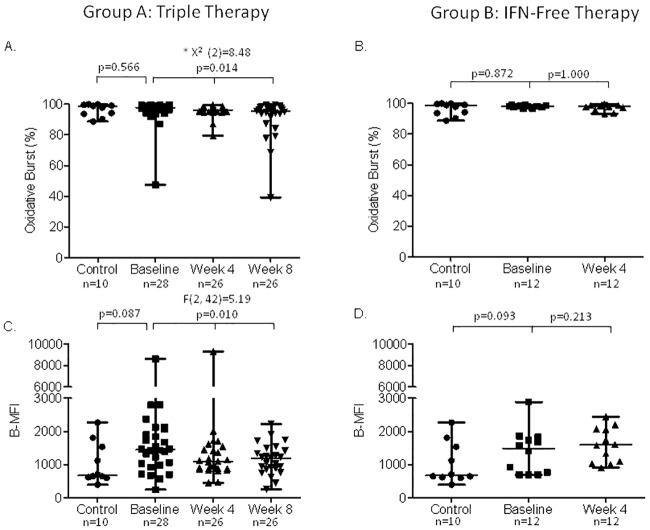
Fig 1. Oxidative burst capacity of neutrophils.
Panel A and B show the burst rate (B-R) in patients treated with triple therapy and IFN-free regimen, respectively. Panel C and D show the enzymatic activity per cell (median fluorescence intensity, B-MFI) in patients treated with triple therapy and IFN-free regimen, respectively. Data are analyzed at baseline (before starting antiviral therapy), and at week 4 and 8 of therapy. * These comparisons were performed by Friedman tests.

