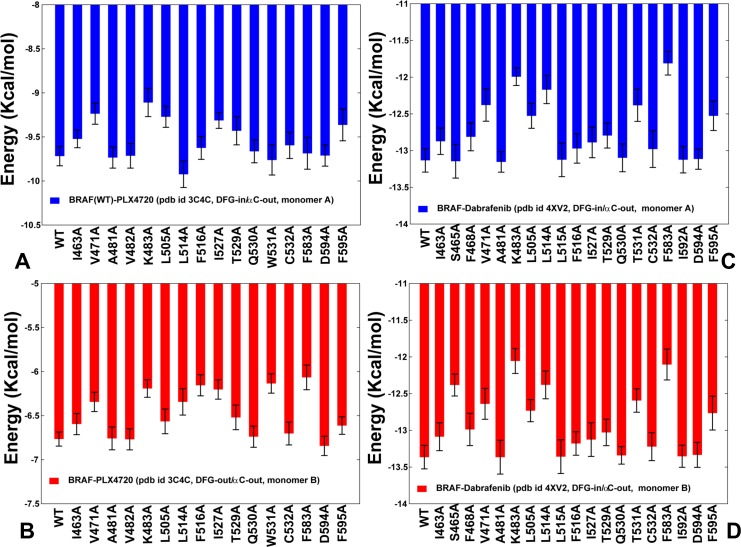
Fig 6. Binding Free Energy Calculations of the BRAF Dimer Complexes with PLX4720 and Dabrafenib.
Binding free energies and alanine scanning of the binding site residues in the first and second binding sites of the PLX4720-BRAF complex (A,B) and Dabrafenib-BRAF complex (C,D). The standard errors of binding free energy differences, which are the standard deviation of the mean values, were ~ 0.11–0.25 kcal/mol for the PLX4720-BRAF complex and 0.18–0.22 kcal/mol for the Dabrafenib-BRAF complex. The results of alanine scanning are shown in blue bars for the first binding site (A, C) and in red bars for the second binding site (B, D).

