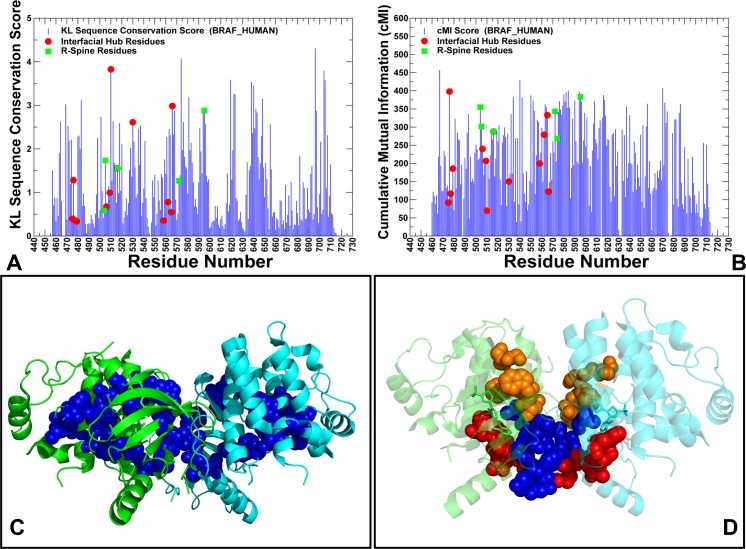
Fig 8. Coevolutionary Dependencies of the BRAF Kinase Residues.
Sequence conservation and coevolutionary propensities of the BRAF residues. (A) The KL conservation score. The residue numbering in the sequence conservation profile corresponds to the residue numbering in the BRAF crystal structures. (B) The cMI profile measures cumulative accumulation of mutual information per residue. The residue profiles are shown in blue bars. The inter-domain interface residues are shown in red circles. The R-spine residues are highlighted in green squares. (C) Structural mapping of high cMI residues (in blue spheres) onto the crystal structure of the Vemurafenib-BRAF complex (pdb id 3OG7). These residues included V471, A481, L515, F516, W531, L537, H574, L577, K578, S579, F583, L584, F595, W619, M620, D638, Y640, F642, and I644. The first monomer is shown in green ribbons and the second monomer is shown in cyan ribbons. (D) Structural mapping of the protein sectors of coevolving residues is shown in both monomers. The binding site sector residues Q530, W531, C532, F583, and S536 are shown in orange spheres; the regulatory sector residues R506, F516, I572, H574, H568, and F595 are shown in red spheres and the dimerization sector residues D449, W450, E451, L505, R509, L514, and F516 are shown in blue spheres.

