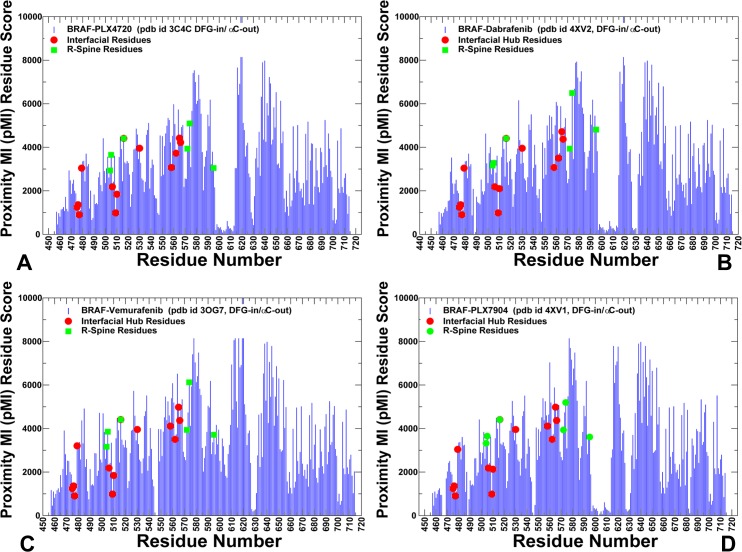
Fig 9. Proximity-based Coevolutionary Profiles of the BRAF Dimer Complexes.
The ensemble-based pMI profiles of the BR AF complexes with PLX4720 (A), Dabrafenib (B), Vemurafenib (C), and PLX7904 (D). pMI values for each residue position are evaluated as the sum of cMI values of all residues within 5Å distance from a given residue. The distance between each pair of residues in the structure was calculated as the shortest distance between any two non-hydrogen atoms from respective two residues. pMI profiles are computed using average values obtained from MD trajectories and ensemble-based definition of the local residue environment. The residue profiles are shown in blue bars. The inter-domain interface residues are shown in red circles. The R-spine residues are highlighted in green squares.

