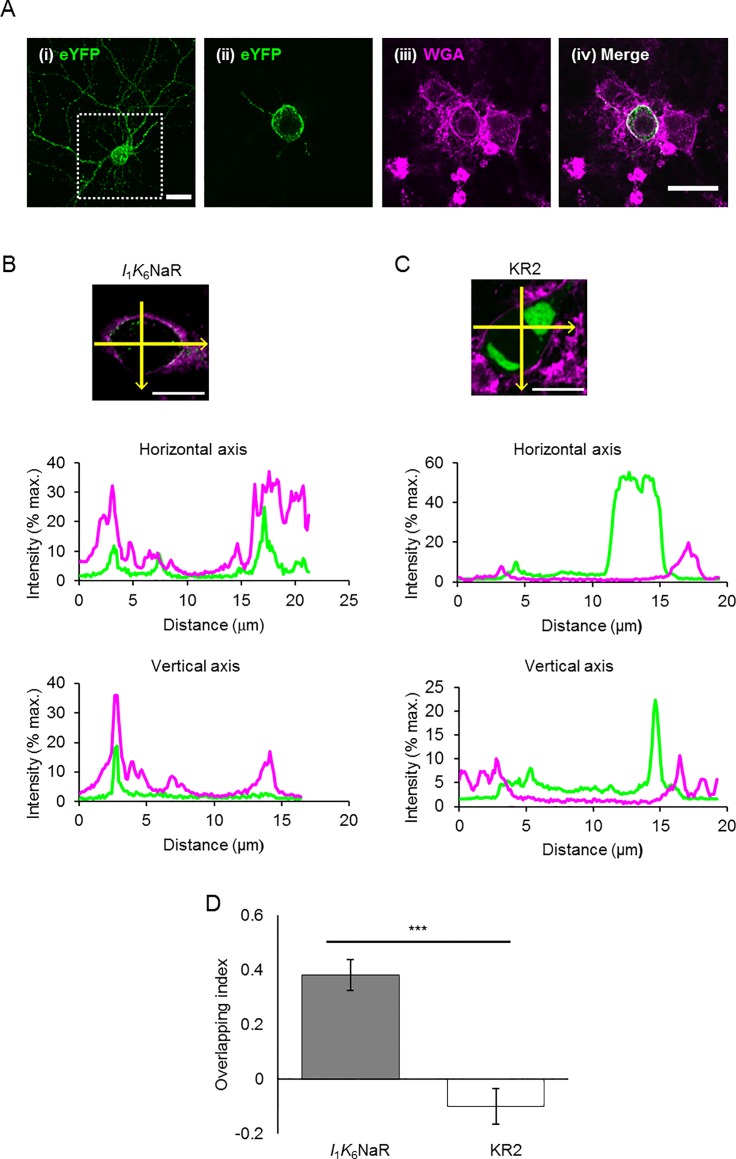
Fig 9. Quantitative evaluation of membrane targeting of NaRs.
(A) Expression of eYFP-labeled I1K6NaR in the cultured cortical neuron. (i) Integrated confocal image of the neuron (Z-stack projection of 12 slices at every 0.46 μm in depth). (ii) eYFP image of a single slice shown in the dot-lined square in (i). (iii) Image of the fluorescent WGA of the same region. (iv) Merge of (ii) and (iii), indicating the expression of I1K6NaR in the neuronal membrane. (B) Profiling of the fluorescent intensity of an I1K6NaR-expressing neuron. The pixel values along the horizontal/vertical axes, which were delineated to pass the centroid of the cell (yellow), were plotted as functions of distance: eYFP fluorescence (green) and WGA fluorescence (magenta). The overlapping index was 0.68. (C) Profiling of the fluorescent intensity for a KR2-expressing neuron. The overlapping index was -0.21. (D) Comparison of the overlapping index between I1K6NaR (left) and KR2 (right). ***, P < 0.0005, Mann-Whitney U-test. Scales, 20 μm for (A) and 10 μm for (B) and (C).

