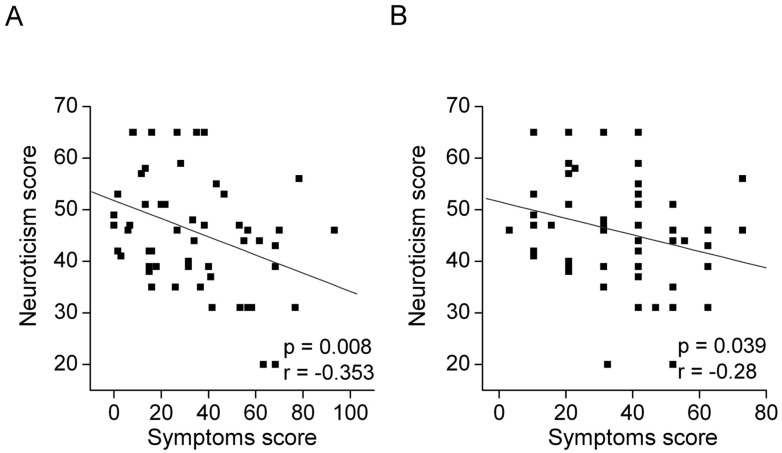
Fig 2. Correlations between the subjective dry eye symptoms and the neuroticism score in the scatter plots.
A) DEQS and Neuroticism. Individuals with a lower neuroticism score (more nervous) exhibited a higher DEQS score (more symptoms). There is a significant correlation between the neuroticism score and the DEQS score (r = -0.353, p = 0.008). r; Spearman’s correlation coefficient. The gray line indicates the regression line. B) OSDI and Neuroticism. Individuals with a lower neuroticism score (more nervous) exhibited a higher OSDI score (more symptoms). There is a significant correlation between the neuroticism score and the OSDI score (r = -0.28, p = 0.039). r; Spearman’s correlation coefficient. The gray line indicates the regression line.

