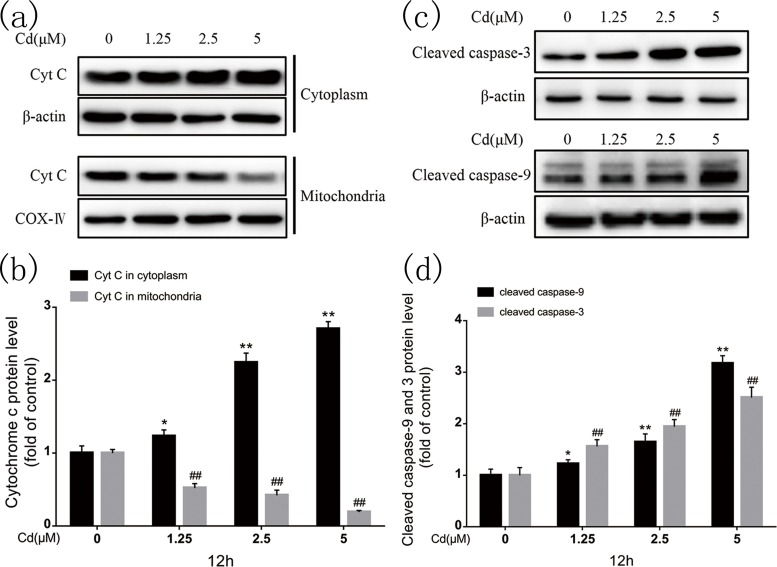
Fig 3. Cadmium induced mitochondrial cyt c release to the cytoplasm and subsequent caspase-9 and caspase-3 activation in rPT cells.
(a, c) Representative western blots of cyt c, cleaved caspase-9, and cleaved caspase-3. (b, d) Quantitative analysis of cyt c, cleaved caspase-9, and cleaved caspase-3 western blots; grayscale of the control was set at 1. Quantitative analysis was performed with images from three independent experiments (mean ± SD, n = 3). *P < 0.05, **P < 0.01, and ##P < 0.01 as compared to control.

