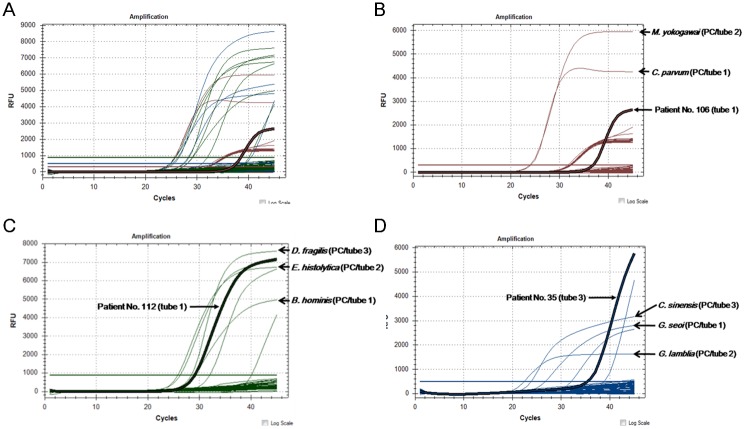
Fig 1. Representative reaction curves of the multiplex real-time PCR assay.
A) Multiple reaction curves indicate amplification of the positive controls and clinical samples obtained from patients with gastroenteritis. B) Positive curves of two positive controls for Cryptosporidium parvum (tube 1) and Metagonimus yokogawai (tube 2) were observed in the Quasar 670 channel. Patient No. 106’s sample showed a positive curve within tube 1 according to Quasar 670 signals. C) Positive curves of two positive controls for Blastocystis hominis (tube 1), Entamoeba histolytica (tube 2), and Dientamoeba fragilis (tube 3) were observed in the VIC/HEX channel. Patient No. 112’s sample showed a positive curve within tube 1 according to the VIC/HEX signals. D) Positive curves of two positive controls for Gymnophalloides seoi (tube 1), Giardia lamblia (tube 2), and Clonorchis sinensis (tube 3) were observed in the FAM channel. Patient No. 35’s sample showed a positive curve within tube 3 according to FAM signals.

