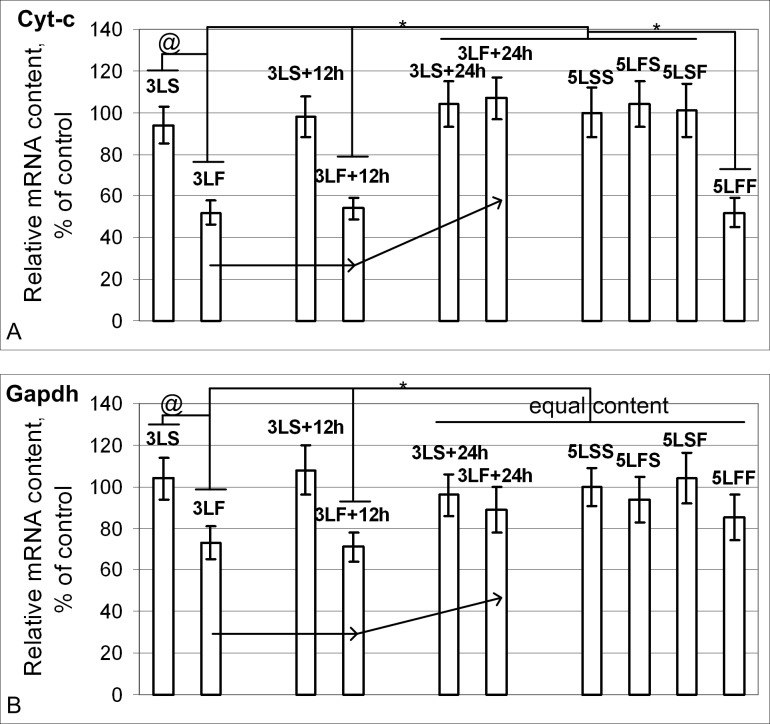
Fig 3. Relative mRNA content of genes (qPCR data) that encode metabolic proteins.
(A) The Cyt-c mRNA content in 3LS, 3LS+12h, 3LS+24h, 5LSS, 5LFS and 5LSF groups was the same. In the 3LF and 3LF+12h groups, the Cyt-c mRNA was reduced by 48% and 46% compared with the 5LSS group (p<0.05) but was restored to the control level in the 3LF+24h group. In the 5LFF group, the Cyt-c mRNA content was reduced by 48% compared with the 5LSS group (p<0.05). (B) The Gapdh mRNA content in the 3LS, 3LS+12h, 3LS+24h, 3LF+24h, 5LSS, 5LFS, 5LSF and 5LFF groups was the same. In the 3LF and 3LF+12h groups, Gapdh mRNA was reduced by 27% and 29% compared with the 5LSS group (p<0.05).

