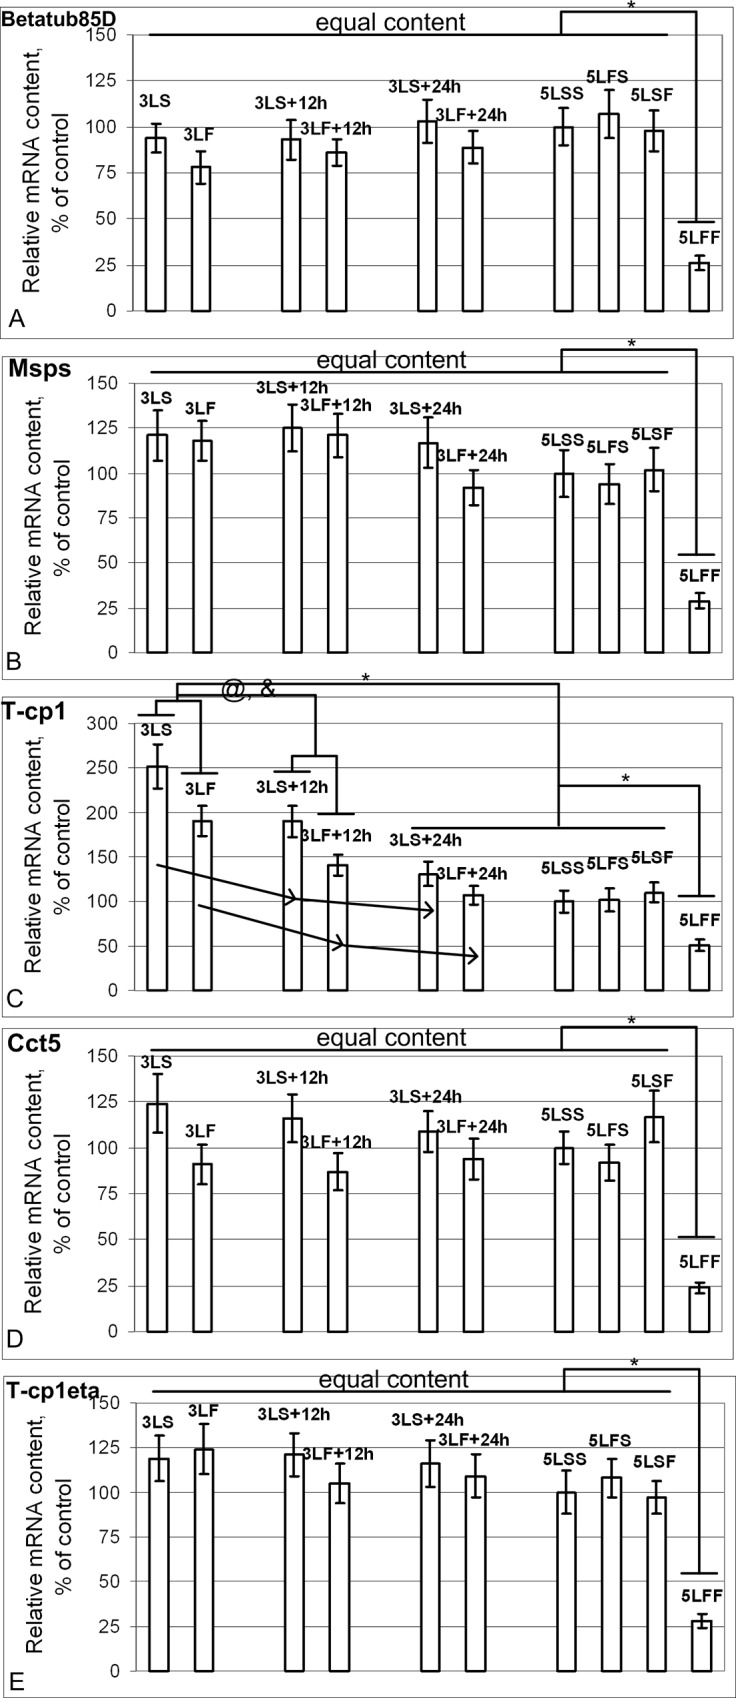
Fig 6. Relative mRNA content of genes (qPCR data) that encode proteins of microtubule cytoskeleton.

(A), (B), (D), (E) The Betatub85D (A), Msps (B), Cct5 (D) and T-cp1eta (E) mRNA contents were the same in all study groups, with the exception of the 74%, 71%, 76% and 72% decreases in the 5LFF group compared with the 5LSS group (p<0.05), respectively. (C) The T-cp1 mRNA content in the 3LS and 3LS+12h groups exceeded the level of the 5LSS group by 152% and 90% (p<0.05), respectively, and by 91% and 41% (p<0.05) in the 3LF and 3LF+12h groups, respectively. The T-cp1 mRNA content was the same as the control level in the 3LS+24h, 3LF+24h, and 5LSF groups. The T-cp1 mRNA content in the 5LFF group was reduced by 49% compared with the 5LSS group (p<0.05).
