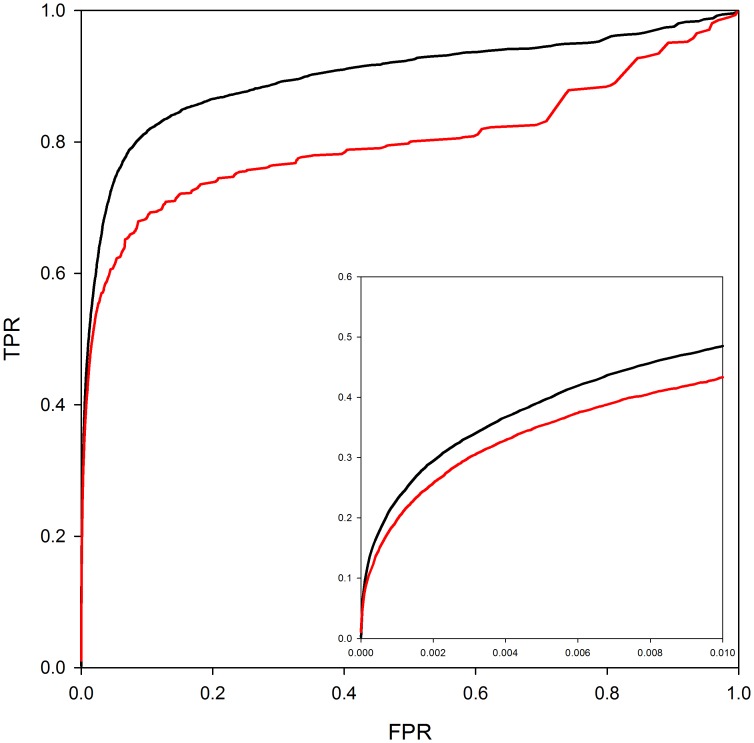
Figure 3. PrePPI performance with and without homology models.
The red line shows PrePPI performance using only crystal structures available in the PDB for individual proteins. The black line shows the performance if both homology models and crystal structures are used.

