Figure 3. Single-molecule cyclic nucleotide binding dynamics at HCN2 CNBDs.
(A) Bound probability from the total fraction of time spent bound for all single molecules as a function of fcAMP concentration fit with the equation Bmax/(1+Kd/[fcAMP]), where Bmax = 0.75 is the maximal bound probability and Kd = 1.5 µM is the apparent dissociation constant. (B, C) Histograms of unbound and bound single-molecule dwell time distributions for events from all molecules combined for (B) various concentrations of fcAMP and (C) distributions for 1 µM fcAMP overlaid with maximum likelihood estimates for monoexponential (blue dashed) and biexponential (red) distributions. Exponential fits with estimated parameters and confidence intervals for all tested fcAMP concentrations are shown in Figure 3—figure supplement 1. (D) Contour plots of two dimensional histograms for the average bound time versus average unbound time per molecule at several fcAMP concentrations. Color bar denotes number of molecules. Symbols denote time constants from maximum likelihood biexponential fits (open circle and triangle) and their amplitude-weighted average (asterisk). Similar contours for all tested fcAMP concentrations are shown in Figure 3—figure supplement 2. (E) Kinetic models between unbound (U*) and bound (B*) states. The model ID number is indicated to the left of each model. Optimized rate constants are given in Table 1. (F) Differences in the Akaike Information Criteria (AIC) for optimized models shown in (E). (G) Comparison of observed dwell time histograms with simulated data from model 4. Histogram abscissas for (B), (C) and (G) were truncated to facilitate visualization of the faster components. (H) Cartoon illustrating a tetrameric CNBD complex formed by appending tetramerizing GCN4 coiled-coil to the N-terminus. (I) Example fluorescence time series (blue) for fcAMP binding events at a single tetramer in a ZMW overlaid with the idealized trace (black). At 300 nM fcAMP, the probability that more than one CNBD is bound at any given time is low. (J) Dwell time distributions for the first binding step in CNBD tetramers. Bound lifetimes are biexponentially distributed as for monomeric CNBDs.

Figure 3—figure supplement 1. Maximum likelihood estimates of biexponential parameters for single-molecule dwell time distributions.

Figure 3—figure supplement 2. Dwell time correlations within single molecules.

Figure 3—figure supplement 3. CNBD tetramer.
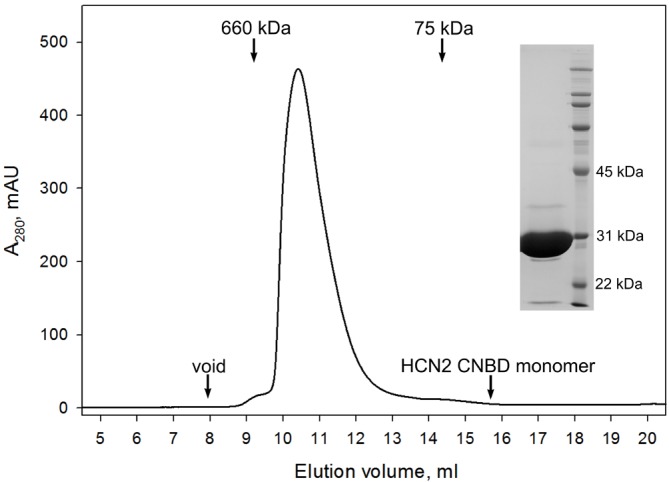
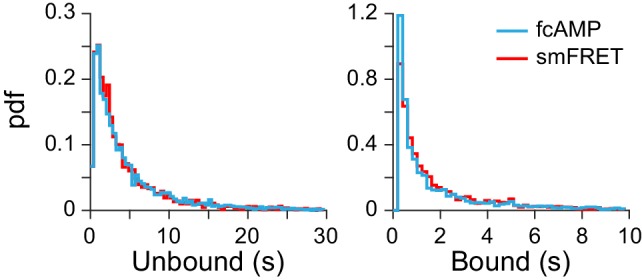
Figure 3—figure supplement 4. Binding with and without smFRET.