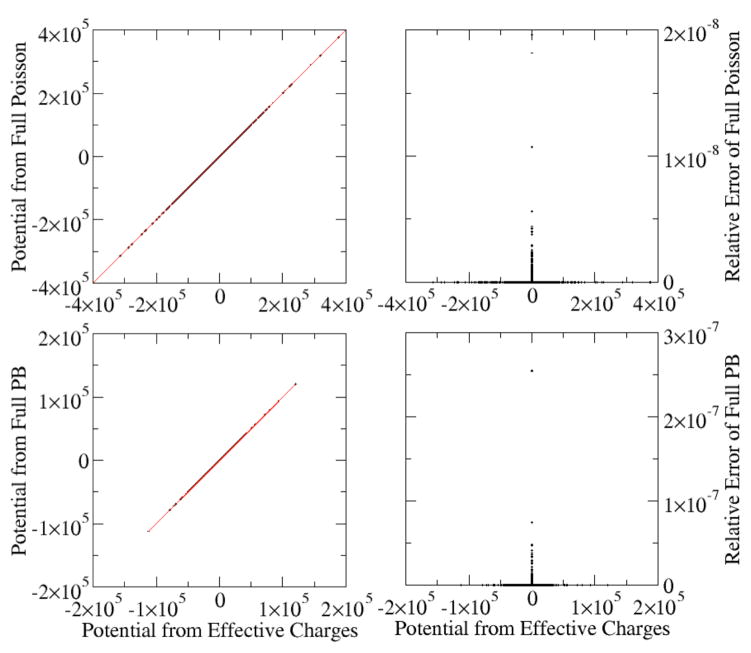
Figure 1. Correlations between grid potentials (kcal/mol-e) computed by the charge view and the full Poisson or PBE methods.
A polyAT DNA was modeled with the full PB or the Poisson equations. The charge view potentials were computed with Poisson with effective charges. The grid spacing is 0.5 Angstrom. Top: Poisson equation. The inside relative dielectric constant is 1.0 (epsin=1.0) and outside relative dielectric constant is 80.0 (epsout=80.0). The root-mean-squared (rms) relative deviation is 9.8×10⁻¹¹. Bottom: PB equation with ionic strength of 1M (istrng=1000). The inside relative dielectric constant is 4.0 (epsin=4.0), and the outside relative dielectric constant is 80.0 (epsout=80.0). The rms relative deviation is 1.0×10⁻⁹.

