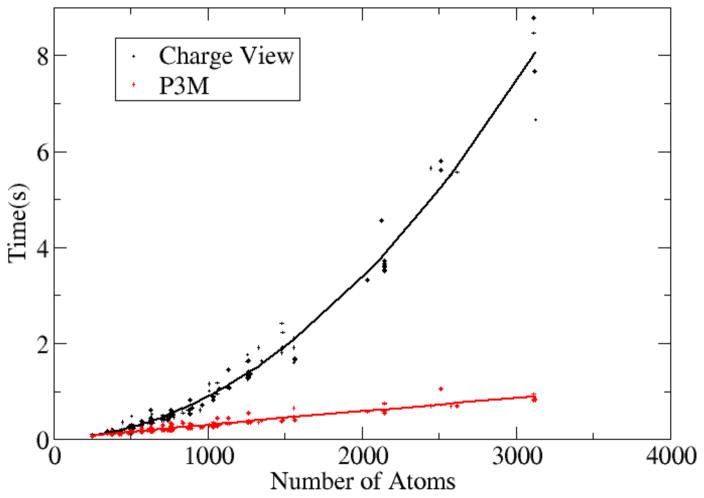
Figure 6. CPU time versus no. of solute atoms for the pairwise charge view method and the P3M method.
The same test set of nucleic acids was modeled with the full PB equation (epsout=80.0, epsin=4.0, istrng=1000) as in Figure 5. The x-axis is the number of atoms in each nucleic acids, the y-axis is the cost of CPU time for computing the energies. The trend lines are fitted functions in the form of y = ax2 + bx + c.

