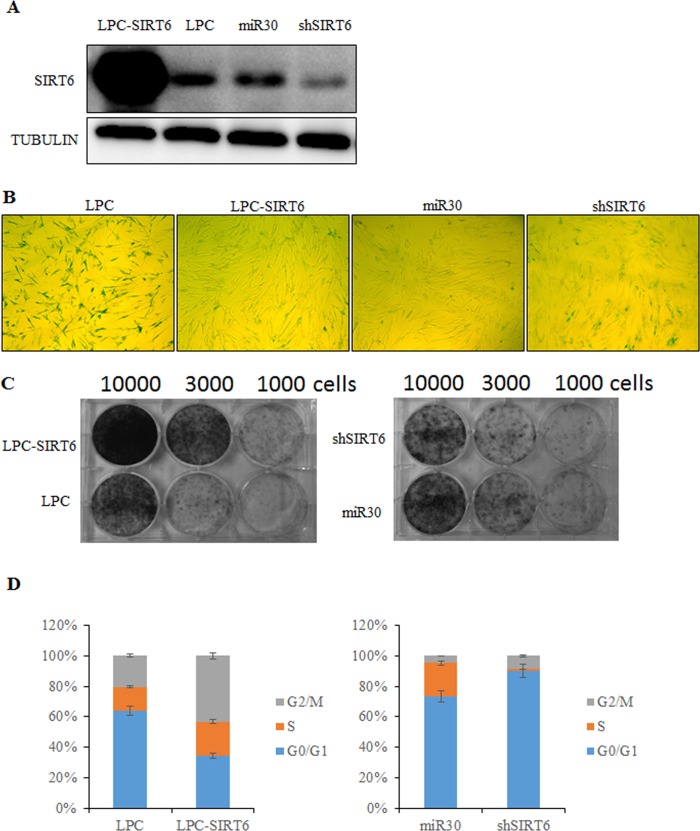
Figure 2. SIRT6 represses senescent-associated features in 2BS cells.
(A) Western blot analysis of SIRT6 expression levels in SIRT6-overexpression (LPC-SIRT6) and SIRT6-knockdown (shSIRT6) 2BS cells. (B) SIRT6-overexpression and SIRT6-knockdown 2BS cells were stained for SA-β-gal activity. (C) Colony formation assay was performed using SIRT6-overexpression and SIRT6-knockdown 2BS cells. (D) Flow cytometry analysis of SIRT6-overexpression and SIRT6-knockown 2BS cells. Values represent the means ± S.E. of triplicate points from a representative experiment (n=3), which was repeated three times.

