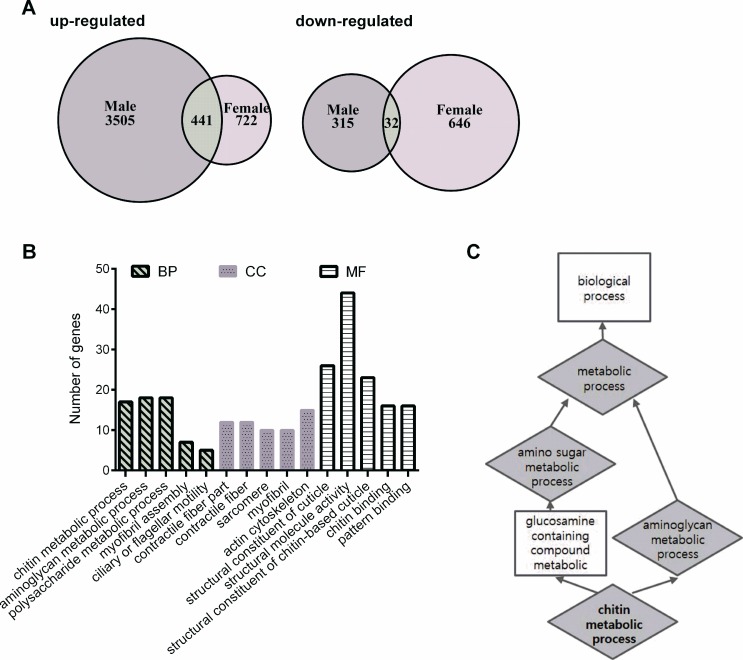
Figure 6. Differential gene-expression analysis and enriched gene ontology categories.
(A) Venn diagram comparing the up-regulated and down-regulated genes in HN-treated flies. (B) Annotated genes from the overlap of up-regulated gene lists can be divided into three major categories, including biological process (BP), cellular component (CC), and molecular function (MF). The vertical scale on the left indicated the number of genes in the sub-categories. (C) The functional enrichment map were illustrated for a number of biological function including the enriched target genes.

