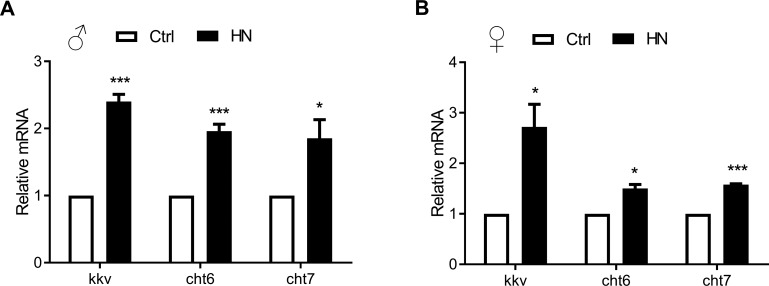
Figure 7. Quantitative real-time PCR validation of HN-treated healthspan genes acquired from microarray analysis.
Long-lived HN exposure flies increased the expression of 3 genes from the most up-regulated genes among GO terms. Error bars denote SEM. Values with different superscripts are significantly different at p <0.05 (* = p <0.05, ** = p <0.01, *** = p <0.01).

