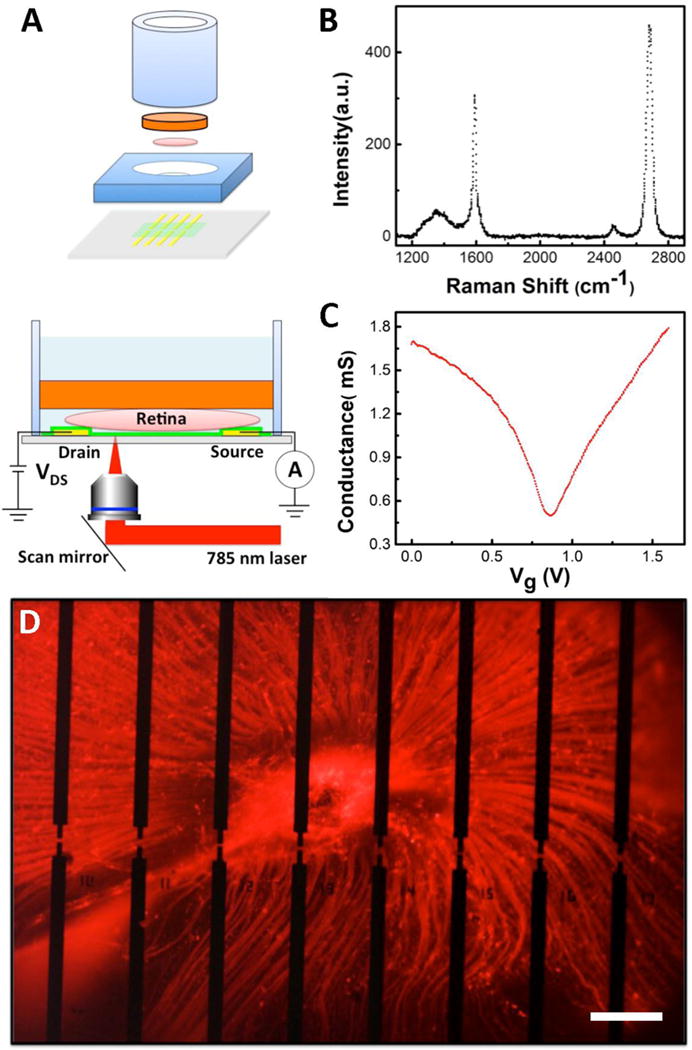
Figure 1.

Overview of the experimental design. (A) Top: Exploded view of a graphene-integrated microfluidic platform. The orange plate is a slice of agar gel. The pink disk represents a retina. The green plane indicates a graphene film. The yellow bars represent Au electrodes. Bottom: Schematic diagram of scanning photocurrent measurements. A one micron diameter diffraction-limited laser spot goes through a transparent coverslip to scan over graphene transistors underneath a retinal tissue in a microfluidic platform. (B) Raman spectrum of graphene on a coverslip. (C) Electrolyte gate response of a typical graphene transistor. (D) Fluorescence image of a CTB-labeled retina on top of graphene transistors. There are 54 separated electrodes in an electrode array, where the edge-to-edge distances between two electrodes in the horizontal direction is 180 μm and between upper and lower electrodes are 20 μm, 40 μm, and 60 μm, respectively. A graphene film is placed on top of all electrodes. Any two electrodes can be used as source and drain electrodes, respectively. Here, 16 opaque electrodes near the ONH are imaged. Scale bar is 200 μm.
