
Figure 3.
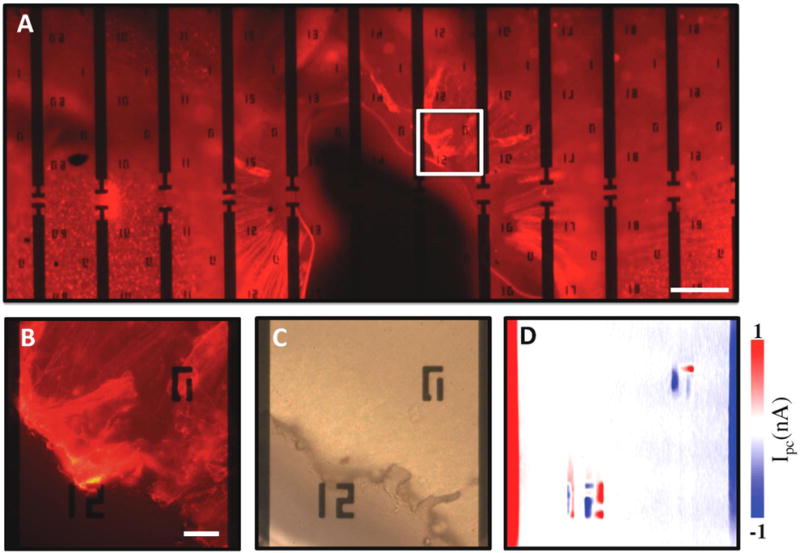
(A) Fluorescence image of a fixed retina. Scale bar is 200 μm. (B) Enlarged fluorescence, (C) optical, and (D) scanning photocurrent images of the retina in the ONH region, respectively. The edge-to-edge distance between two electrodes is 180 μm. Scale bar is 30 μm in B–D. ‘12’ and ‘0’ near electrodes are metal markers for location.