
Figure 4.
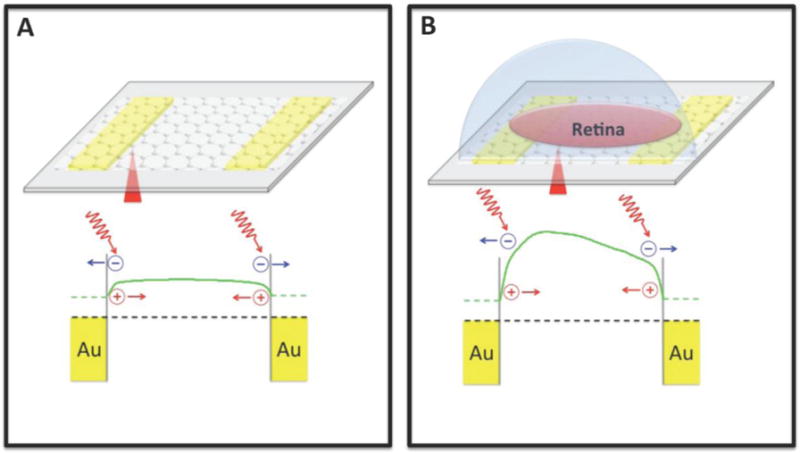
Schematic diagrams of band structures of a graphene transistor. (A) Photocurrent signals generate at graphene-metal junction areas due to the band structure bending. (B) A retina can modulate the carrier concentration of graphene underneath it. Green solid lines show potential profiles. Black dashed lines denote the Fermi levels. Note that in (A) and (B), the potential profiles are obtained through numerical integration of the scanning photocurrent profiles along the dashed lines in Figure 2H and 2D, respectively.