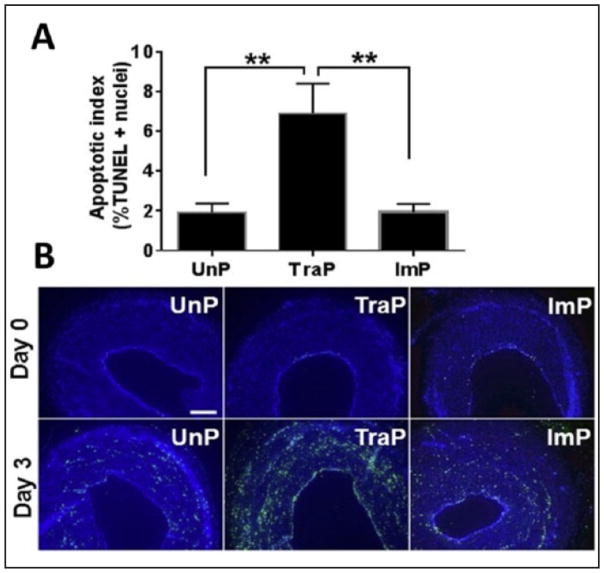
Figure 7. TUNEL apoptosis assay.
A- **P ≤ .01. Error bars represent standard error of the mean. B- Representative images of TUNEL staining. TUNEL-positive cells appear in green. Top row: Day 0; bottom row: Day 3. Scale bars = 200μm.
TUNEL, terminal deoxynucleotidyl transferase dUTP nick-end labelling; UnP- unprepared tissue; TraP- traditional preparation; ImP- improved preparation

