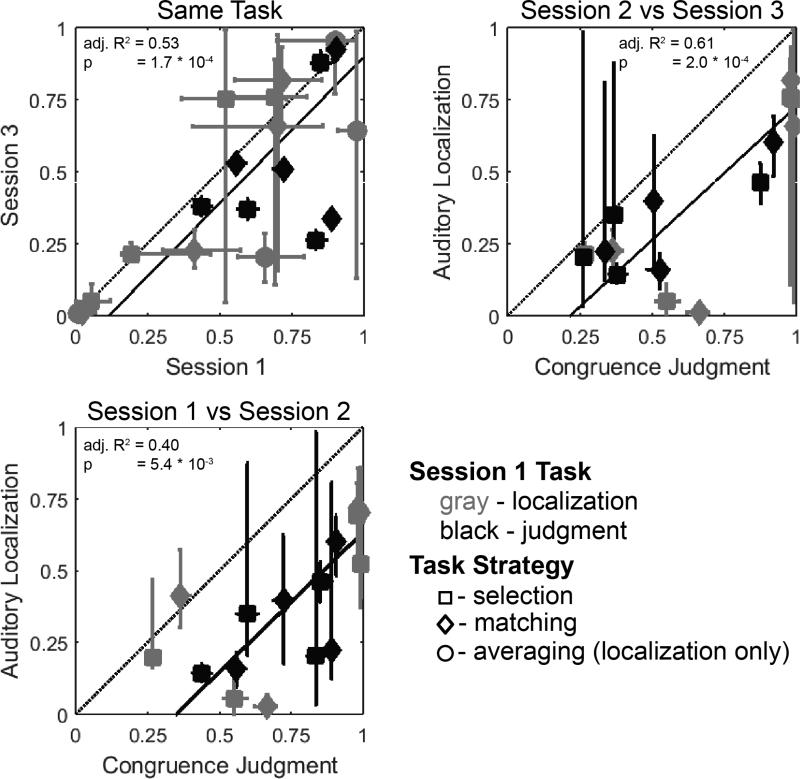
Fig. 6.
Prior Expectation of a Common Source (pcommon) correlated across sessions. Each point represents a pair of median model fit values for pcommon from the same subject and task strategy, across two different sessions. Each pairwise correlation of parameters across sessions is represented by a separate subfigure. As shown, when the same task was repeated subjects generally demonstrated good agreement in fitted values, but across tasks pcommon was significantly lower in the auditory localization task than in the congruence judgment task (black trend line was significantly lower in cross-task comparisons, Session 1 vs Session 2 and Session 2 vs Session 3, than in the Same Task comparison). Multiple task strategies were considered as in Wozny et al. (2010), although parameter estimates were similar across task strategies and group trends were consistent regardless of task strategy. Error bars represent 95% parameter ranges, estimated from the 120 runs of the model fitting algorithm. Standard Major Axis Regression (Legendre, 2013) was used to fit trend lines.

