
Figure 2.
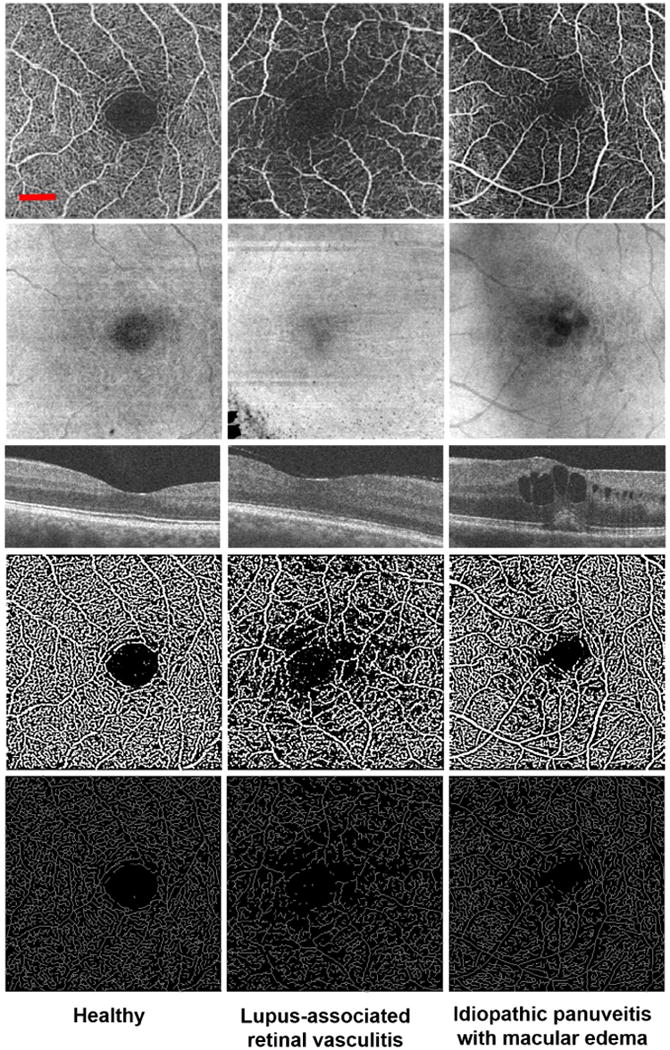
Non-segmented optical coherence tomography angiography (OCTA) images of the parafoveal capillaries in healthy and uveitic eyes. Columns represent one eye each from 1 healthy and 2 uveitic subjects, as labeled at the bottom of each column. Rows represent the different types of images evaluated in the study for each eye, including (from top to bottom): original grayscale OCTA, structural en face, OCT B-scan, binarized image, and skeletonized image. (Left column) Representative eye from a healthy 34-year-old female subject. (Left column, top row) The grayscale OCTA image shows normal foveal capillary perfusion. (Left column, second row) The corresponding structural en face image showing no significant artifacts. (Left column, third row) Cross-sectional OCT B-scan showing no edema. (Left column, fourth and fifth rows) The binarized and skeletonized images are included for enhanced contrast of vasculature. (Middle column) Uveitic eye of a 63-year-old female patient with systemic lupus erythematosus complicated by retinal vasculitis. (Middle column, top row) The grayscale OCTA image shows lower density and branching complexity of the parafoveal vasculature. (Middle column, second row) The structural en face image shows some loss of OCT signal in the bottom left corner of the image that does not impact the interpretation of the image. (Middle column, third row) OCT B-scan showing no edema. (Middle column, fourth and fifth rows) Areas of impaired perfusion can be seen more clearly in the binarized and skeletonized images, respectively. (Right column) A 29-year-old female with idiopathic panuveitis. (Right column, top row) The grayscale OCTA image shows distinct areas of impaired retinal perfusion extending into the fovea. (Right column, second row) The structural en face image shows areas of dense, circumscribed hyporeflectivity in the fovea, as well as an overlying shadowing effect. (Right column, third row) Corresponding areas of circumscribed hyporeflectivity on OCT. (Right column, fourth and fifth rows) The binarized and skeletonized images show disruption of the foveal avascular zone in areas corresponding to edema. The red scale bar (top left) shows a length of 500 μm. This scale applies to all images in this figure except the OCT B-scan (middle row).