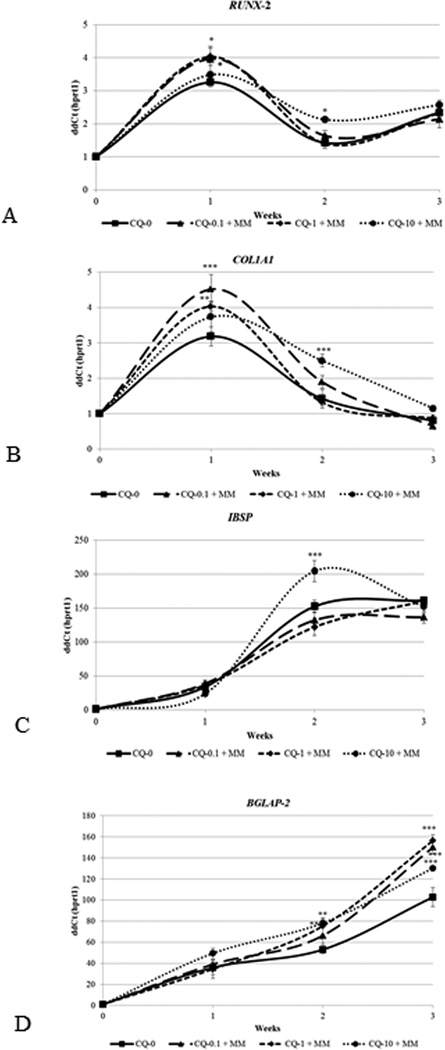
Fig. 4.
Effect of CQ-E treatment on expression of Runx 2 RNA (A), Col1A1 RNA (B), bone sialoprotein RNA (C) and osteocalcin RNA (D). Confluent cells were treated with CQ-E at indicated concentrations in mineralizing medium (having ascorbic acid and β-glycerophosphate) for 3 weeks. Gene expression was analyzed every week. CQ-0, 0.1, 1 and 10 represents concentration of CQ-E in µg/ml.
*P< 0.05, **P< 0.01, ***P< 0.001.

