Figure 5.
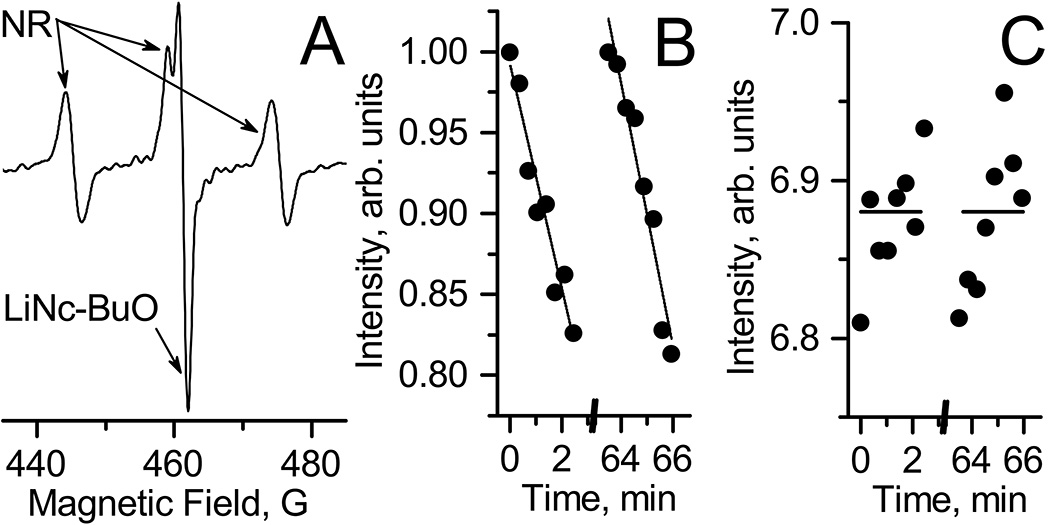
A. EPR spectrum measured in vivo from A 549 xenograft tumor in nude mouse after i.t. injection of soluble NR probe. The observed triplet spectrum of the NR is superimposed with a single EPR line of LiNc-BuO microcrystals embedded within tumor. B. The normalized kinetics of low-filed component of NR EPR spectra before and 60 minutes after i.v. tail injection of saline solution. Lines represent the linear fittings of kinetics yielding values 1.15·10−3 s−1 and 1.35·10−3 s−1 for line slope for 1st and 2nd kinetics, correspondingly. C. pH values obtained using EPR spectra of NR probe before and 60 minutes after saline injections. Horizontal lines are represent the average values equal to 6.88.

